 |
| |||||
| |||||||
|
April 2001 Full
contents
Project and Plant Management Creating plant operating excellence with measurable results For an average-sized refinery, these improvements should deliver an economic benefit of $25 million/year Years ago we just operated plants. Corporate offices took care of the
business and economic aspects. Today with flatter organizations and
extreme competitive pressures, plant management and technical staff have
the added responsibility for the business side of plant operation.
Frequently, they feel ill-prepared to deal with the wide span of
responsibilities. How can the business and economic aspects of the plant
be integrated with the operational aspects? How can the business awareness
of the employees be increased?
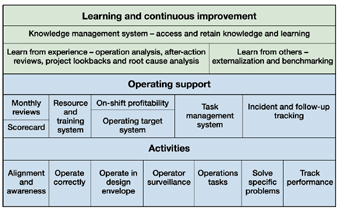
THE ACTIVITIES Alignment and awareness. Success in operating a plant is dependent on awareness and alignment of objectives. This starts with sharing the annual business and operating plan, including its milestones and benchmarks. Tracking progress toward goals is a key to motivation. Many plants have quarterly communication sessions for all employees, monthly business review with the managers where operations are reviewed, intranet sites with timely messages from management, and a scorecard that measures plant safety, environmental, operational and economic performance. Operate correctly. Operational success requires running the plant properly. This is dependent on having knowledgeable, skilled operators and good training and resource materials. It is tempting to rely solely on the experienced operator to train the new one. This is the easiest and lowest cost way. However, training quality will vary greatly according to the talent and interest of the experienced operator. In addition, operating methods will drift in different directions over time. Some portion of the training and understanding that was established at startup will be lost with each passing of the baton. Operate in design envelope. Operating outside the design or "normal" operating envelope is the cause of many plant problems. Plant reliability engineers sometimes refer to this as "equipment abuse". Operator surveillance. Operations supervisors and managers have recognized the importance of operators touring their units periodically. We call this operator surveillance. Operating tasks. Many tasks need to be done in a plant to achieve smooth and reliable operation that meets all requirements. Examples of these tasks are:
Track performance. Tracking performance is crucial to achieving alignment and making progress toward goals. What should be tracked? Key areas are: safety and environmental performance compared to history and goals; leading indicators for safety and environmental performance; operating performance compared to history, benchmarks and goals; performance in other prime areas such as maintenance efficiency; and, finally, economic performance compared to business plan. Tracking progress toward the ultimate objective even if it is still far away unites people and can create a positive winning spirit. OPERATING SUPPORT Scorecard-alignment and awareness. Using a scorecard to show performance and progress toward goals can enhance alignment and communication across the plant. Tracking progress toward goals is fundamental to motivation. Drilling the scorecard down from plant level to departmental level to process unit level and, ultimately, to shift and individual levels is a key to empowerment. These are common management ideas. Why is it called a "scorecard"? In sports, when you are winning (things are coming out the way you want them to), the normal strategy is that you should continue playing your game. However, when you are losing; you should change your game. The function of the scorecard is to tell the team if they are winning or losing. If they are losing, they need to change something and watch the scorecard to see if the game turns around. One of the drivers to learning is to do something different when needed and see how it works. What should be on the scorecard for a plant? The same measures previously mentioned under the "track performance" subhead. People can know whether or not to change the game plan only if they know the score. The plant should have a set of intranet sites to aid communications. The scorecard should be the home page of the intranet sites so everyone, the whole team, can see it. The scorecard should show the metrics for the whole plant. As an organization matures in tracking performance and progress toward goals, the frequency of the measurement should increase. Ultimately, the scorecard should show daily profitability and performance on principal process variables. With recent wild swings in raw material costs and product values, tracking the gross margin and putting that on the scorecard can help increase employee awareness of the business climate. I recently talked with a refinery manager who was delighted with a query he received at a quarterly employee communication session. During the Q&A, an operator said that he had noticed from the scorecard on the Websites that margins were poor and the refinery was losing money. The operator questioned, "How patient is the top management going to be with that? What is being done to turn that around?" Resource and training system-operate correctly. To achieve excellence in operation, a structured approach to training is needed. Today, a computer-based training system is usually found at the heart of a structured training and resource system. Maintaining an effective training and resource program without such a system is so tedious and demanding that it probably isn't practical or even possible. Operators need ready access to resource materials. This includes process flow diagrams, process descriptions, plot plans, information on equipment, noise contours and laboratory sample schedules. An important realization is that engineering drawings frequently need to be supplemented with training or resource drawings developed by operating people for the specific purpose. For example, understanding how a complex heat exchange network on a multidraw distillation column operates is very difficult from a P&ID. Much more effective is to create a simplified drawing specifically for this purpose. The operating procedures are, of course, a critically important part of this resource material. A site should set up a standard outline of procedure and resource documents for use in each department and unit to make it more easily accessed by people who work across the facility. Training and resource materials can be integrated into the site's intranet to make it readily available. To facilitate administration and ensure compliance with OSHA process safety management requirements or maintain an ISO certification, it is useful for the documents to reside in a document management system that can accommodate the periodic reviews and approvals. Once all training and resource materials are available, the next part of a structured training and proficiency development program is to define skills needed to perform each job. This set of skills can be laid out as a "training path." The training path should specify knowledge and proficiencies needed to do the job effectively. Incorporate "quizzes" to verify understanding after classroom or computer-based training, including simply studying operation resource materials and procedures. Successfully passing the quiz can create a training record in the system to provide documentation of the training. Field demonstration of proficiency as described below can be an important part of this training path. Several good computer-based training and training records systems are available. A state-of-the-art training and training records system should have all the necessary functionality. A good feature is one that allows a person to demonstrate proficiency in an activity-e.g., lighting-off a furnace-and have a "subject matter expert" sign off on the demonstration of competency using a checklist. This provides verification of field know-how, not just "book learning." An effective system is also Web-browser-based and seamlessly integrates with other browser-based products. Operating target system-operate in design envelope. To keep operating units in the design envelope, ranges are established for all process variables. Each shift, the operation is reviewed to identify operation outside the range, and actions are taken to return to the design envelope. The first step is establishing the design or "normal" operating range. This is not as simple as it first seems. A substantial process unit in a petrochemical plant or refinery has about 300 to 350 continuous process variables that constitute the design or normal operating envelope. Of these, about 35% are equipment related. Establishing the limits is of necessity a multidiscipline activity. Operations people should have the lead roles and the plant process engineer should be heavily involved. Participation needs to come from the rotating equipment engineer, quality assurance, corrosion engineer, pressure integrity engineering, and environmental and safety. Three sets of limits are established:
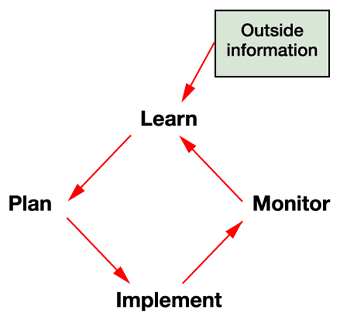
With limits established on all process variables, the current operation should be compared against the limits toward the end of each shift. The operator should be required to comment on why the variable is outside the limit and what corrective actions have been taken to get it back into the normal design envelope. These operator comments should be included with the shift report. This activity can be done on paper, but having a computer system is a big advantage. The computer system should be integrated with the DCS and the resource and training system. Naturally, a number of the variables are variables in the scorecard. On-shift profitability. As limits are set for keeping the process within the design envelope, establish key performance indicators for the unit. Also determine economic incentive for moving the unit in the desired direction. With these critical performance variables and their unit value established, calculating the relative profitability of each shift is easy. All that needs to be done is to create a base case using data from the process historian. Each shift, base value for each of the key performance indicators is subtracted from current value, and the difference is multiplied by the economic value per unit for that variable. Adding up the deltas gives the relative for that shift. The operator should be asked to comment on this, and the report with the comments should be posted and used in the scorecard drill down. On-shift profitability reports provide the shift level information for the Scorecard. Task management-operator surveillance. Structuring this "look, listen and feel" activity is another important aspect of successful operation. Experienced operators and supervisors should define a route and activities during the route for unit surveillance. The operators should perform a survey of the unit each shift. Hand-held computers are now available that can be used to make surveillance more detailed. The devices can also operate off radio frequency transmitters so that they can interact with central computers. With these devices, detailed lists of what to look for can be provided. Equipment tags can be installed at the equipment and read with the hand-held computer to identify a specific piece of equipment or location in the plant. This allows even more detailed inspections. Task management-operations tasks. Thousands of tasks need to be done to have a successful operation. But, sometimes, it is very difficult to administer a system that performs all the tasks, performs them well and uses the required documentation. These tasks can be scheduled and done the old-fashioned way: by creating a checksheet for each task and setting up a call file on when to do them. Or use a task management computer system. An advantage of using a computer system to do the tasks is that the reporting features can allow easy generation of completion reports and overdue reports. These are especially important where the task is done to meet a legal requirement and where the activity's records are subject to an enforcement agency audit. Computer systems that support this activity become quite complex. They can have the shift schedules embedded in them to keep the selected task off day shift-when operators are typically very busy with maintenance work. The computer can also be used to ensure the tasks are evenly distributed among the work force. Most operating tasks are like those above; something is performed using a checksheet on a prescribed interval. Another type of task is when something should be done a certain way, but it cannot be scheduled. Examples include preparing for an approaching hurricane or freezing weather. For these kinds of activities, the system should simply provide the checksheet to be used as needed. Incident and follow-up tracking. Review all significant operating incidents (safety, environmental and reliability). Many of the incidents have mandated reporting requirements. These reports are complex and difficult, especially the environmental reports. Having one system for collecting the information is desirable, but such a system gets quite complicated. Once the mandatory reporting requirements are satisfied, the plant can focus on the learning opportunity. This should start with a root cause analysis. Following the root cause analysis, each incident should be reviewed by systemic cause. A structure for this analysis is needed. Several layers of classification may be desired. One layer is classification by problem type: reactor, rotating equipment, heat exchange, instrumentation, operating, etc. A second classification is by "second-order cause" such as: lack of training or procedure, incorrect procedure, failure to follow procedure, human error, design problem, and accepted risk. Classification by second-order cause, and perhaps deeper level causes, can guide improvement efforts. A good idea is to establish the deeper level classes based on analysis of actual incidents rather than simply thinking them up. You won't find what you don't look for. The next step is to establish an effective follow-up tracking system. Define what the "criteria for success" are in follow-up tracking. For example, the criteria might be to be able to demonstrate exactly what was done very specifically to follow up on each incident. Does the objective also include identifying contributing causes and mitigating these? Does the follow-up goal include identifying systematic causes from all incidents analyzed together and mitigating these? Incident follow-up can be much more than it first appears. The reason is that action plans naturally increase in specificity over time and implementation. In the end, actions need to be very specific. For example, an appropriate action plan immediately after an incident is to "determine the proximate cause, implement mitigation of the proximate cause, conduct an analysis to determine root cause and take immediate steps to mitigate root cause and important contributing causes." Very little detail of exactly what is going to be done is available early on. Furthermore, plans can change as additional information is obtained over time. A second reason follow-up tracking is difficult is that it normally involves a number of people. The person coordinating the follow-up delegates action items to others. A common failing is that the "delegatee" doesn't really accept the action item as the "delegator" requests. The delegatee may want to rephrase the action item or may, in fact, be unable to do it. For follow-up tracking to really work, these realities have to be recognized. An effective system allows a delegation to be rejected, rephrased or accepted. If the delegation is rephrased, the follow-up coordinator must reexamine the logic and completeness of the overall follow-up plan. If there is a series of delegation layers, the logic and completeness must be managed at each level. LEARNING AND CONTINUOUS IMPROVEMENT Taking all the previously suggested steps results in consistent, high-quality operations. In today's environment, however, this isn't good enough. Constant improvement is now mandatory; it is a requirement for financial success and survival. Fortunately, adhering to this framework also provides a base on which to build the learning organization and continuous improvement. The significant concept here is the "learning cycle" (Fig. 2). There are basic steps and principles behind creating, learning and improving. These principles-a simplification and adaptation of the scientific method-act over time to create a continuous and upward spiral of performance.
Learn from experience-operation analysis. The first section of the plant management model provides the foundation for improvement. Learning and continuous improvement start with analysis of current performance. This performance analysis is shown as the "learn from experience" box in Fig. 1. Analysis of operating exceptions. Going back to "operate in design envelope," each month the exceptions for each unit should be analyzed. Usually the plant process engineer performs this analysis. The analysis should start with a trend plot of key performance indicators, variables that show the unit's bottom-line results. Factors that influenced performance should then be reviewed. The analysis should also include a trend chart of the number of critical and standard exceptions. The number of exceptions should decrease over time. A Pareto analysis of the exceptions should be used to identify the most frequent exceptions. These reflect persistent problems that are outside the operators' ability to control. In many cases, they reflect unresolved plant design problems. The operating team should discuss what is being done to resolve these problems. Statistical parameters behind the normal exceptions should be reevaluated monthly and reset quarterly. With this, the process should automatically be continuously improving. Analysis of task data. Data from the task management system can be analyzed to identify problems with these activities. Examine the frequency that inspections find problems. Often it is hard to imagine why a piece of equipment that was in good order one month should be bad the following month. Another useful analysis is to compare the percentage of failed inspections in different departments or sections using the same inspection checksheet. Variations might indicate differences in environmental conditions (say corrosion due to mist coming from a nearby cooling water tower) or might indicate different interpretations of the inspection criteria. Be prepared. Likely the people in the plant have been aware of these problems and complaining about them for years. Or perhaps they gave up complaining and just learned to live with it. The data from a task management system can be used to adjust the frequency of inspections or preventive activities. Wouldn't it be great to have a statistical analysis to answer the question: "Why do we do this once a month?" Such analyses can reduce the costs of the activity. After-action reviews. These should be conducted after all major activities in the plant: turnarounds, new plant startups, shutdowns, etc. The reviews should address what went well and what didn't. Care should be taken to ensure they do not sink into blame or inter-departmental disputes. The emphasis should be on learning. Follow-up should be identified. The first step in planning the next event should be an examination of the after-action review from previous, similar events. Project lookbacks. Lookbacks should be conducted on all projects to see if they delivered the promised results and to review any problems. A one-page summary of the lookback should be made. Periodically, all lookbacks on projects done in a certain time period should be reviewed. The time period should be adjusted to include at least 50 projects so that the conclusions are meaningful. You could call this a "recap" to distinguish it from the individual lookbacks. This study should address questions such as:
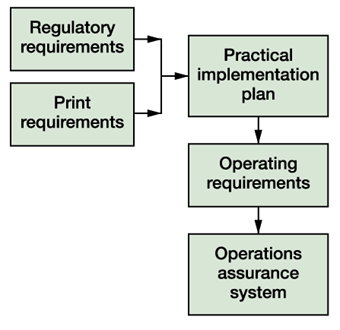
Benchmarking and external data are important in setting goals. Tracking systems need to be designed using definitions that result in comparable data. Knowledge management system. In many fixed-cost reduction programs, the central files of sites were reduced to only those that were legally required, and the file clerk was assigned to other activities. While companies survived the cost pressures, ironically they did not survive the electronification of the documents. As organizations seek to encourage sharing of knowledge and learning, recreating central files is essential. It makes no sense to work hard encouraging collaboration, sharing and learning while daily either throwing away all the valuable knowledge that has been developed or putting it in isolated individual filing systems. Most sites have engineering drawing management systems. The role of these systems needs to be expanded to include all enterprise documentations. Having access to the information and knowledge of the organization is vital to success. The organization's knowledge should be online, immediately available to all who need it! The documents displayed via intranet sites or portal should reside in the enterprise document management system. The document management system's powerful administrative tools can be used to ensure that operating procedures subject to OSHA management of change are reviewed periodically as required. The system can ensure accuracy of information in the Websites, and it can manage document retention requirements. All the documents should be accessible by a powerful and flexible search engine, a crucial part of the document management system. RISK REDUCTION, COMPLIANCE ASSURANCE Another benefit of managing a plant with systems such as those described is risk reduction and improved compliance with mandated requirements. A compliance assurance model is shown in Fig. 3. This systematic approach to plant management both decreases risk and improves compliance assurance. Risk reduction comes from the improved operation. A better way. Most compliance programs have two problems. First, they establish the requirements but do not deal with meeting the problems. If you are in an operating organization, you have experienced this. A mandate comes in from safety, environmental or corporate. The mandate is usually "unfunded" and leaves implementation entirely to the plant. The second problem is that the requirement is usually general or abstract and cannot be implemented as is. The requirement may be that the plant must "ensure that all of the operating people are familiar with the environmental requirements for their unit" or that "all of the environmental equipment is kept in good working order." The "how" is frequently not there. The systemic approach to plant management makes coping with this relatively easy. An implementation plan is developed for each mandate; the plan is put in use and documented as implemented.
COST TO IMPLEMENT Implementation of the plant management methods and systems is expected to give roughly a nine-month payout time. Each of the systems requires about three months work to implement in addition to systems development. The exception is the task management system, which requires a fair amount of equipment information to be entered. Thus, implementing the task management system takes about three months per major process unit. Early plant benefits. One of the saving graces is that the plant gains much of the program's benefit before it is deserved. This is because the performance of plant personnel improves before all of the systems are implemented simply due to the emphasis on their work and contribution. This effect substantially offsets the cost of implementation. In fact, implementation cash flow may be positive from the beginning. There have been many efforts to change the culture in plants. Management has tried to get the employees to be more business focused, we have preached Total Quality Management and we have extolled employees toward root cause analysis. Results from these programs have often been disappointing. This is because we have had it backward. Culture follows behavior. Implementing the program described here will result in culture change within the plant. ECONOMIC BENEFITS For an average-sized refinery in the U.S. with 40 operating jobs, 700 employees and an annual fuel bill of $80 million, these improvements should deliver an economic benefit of approximately $25 million/year. A brief history . . . About ten years ago, when I worked at a large refinery and petrochemical complex, we were having trouble with our aqueous effluent treatment plants. Violations of our environmental permit were fairly frequent, and management was concerned that we might be subject to enforcement action from an agency. One day the general manager of the complex said to me, "Mr. Gillard, somewhere there is a technical superintendent who can get this plant on-spec, and I sincerely hope it is you." I said, "Yes, sir," and went to work with determination and a sense of urgency. Several years later, the environmental agency visited the plant on a routine inspection. Over the next few days, they thoroughly audited plant operations. Two weeks later, we received a letter saying that they had found no problems in the plant. Then they added the gratuitous comment that the plant was "well operated and maintained." The core of the methods and systems described here were developed in response to that general manager's mandate. To achieve operating excellence, the methods have since been expanded into a comprehensive interactive system of computer-based applications that include the entire plant.
| ||||||||||||||||||||||||||||||||||||||||||||||||||||||||||||||||||||||||||||||||||||||||||||||||||||||||||||||||||||||||||||||||||||||||||||